Chaparral Regeneration: Post-Fire Recovery Strategies in California’s Shrubland Biome
The California Chaparral Institute is a nonprofit environmental organization dedicated to protecting California's chaparral biome — the state's most characteristic, yet most imperiled, native shrubland ecosystem.
In their book Fire, Chaparral, and Survival in Southern California, the authors have included an index: The Essential 64 Plants and Animals of Southern California Chaparral. This visualization illustrates the six primary strategies these plants use to regenerate after a fire. It will be included in the upcoming edition of the institute’s periodic journal.
Tools: Illustrator, Photoshop
Tag: data visualization, infographics, environment


Data Placemat Design: Sleep Number’s Audience Segments
Sleep Number currently use their audience segments to develop targeted communications, but their most recent audience “placemats” needed an overhaul.
72andSunny tasked me with creating a modular design system for 5 developed segments as well as a template for future use. Built out in PowerPoint, this presentation is easily editable by non-designers and provides a quick understanding of both qualitative and quantitative information. With a lot of data to include and limited real estate, I created custom charts and layouts with a clear informational hierarchy and easy-to-follow instructions.
Note: data has been modified/removed to protect client confidentiality
Tools: PowerPoint
Tag: data visualization, infographics, presentation, market research


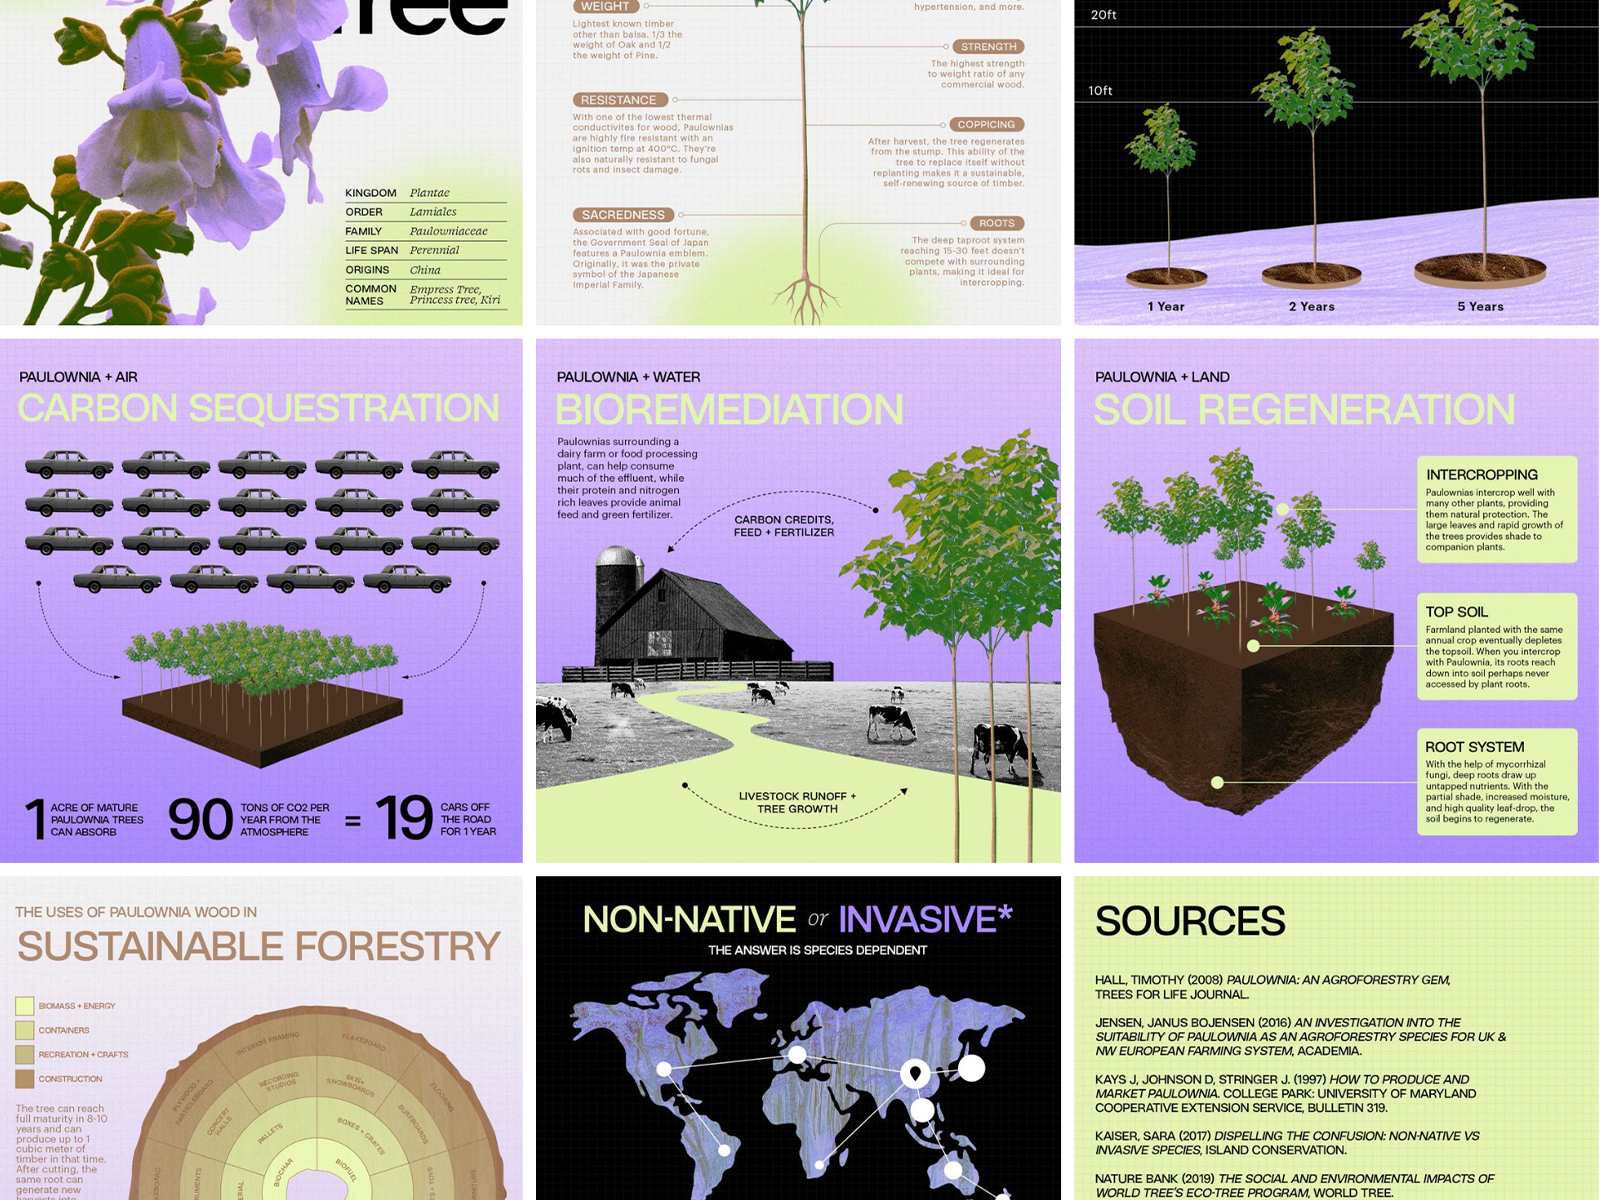
Paulownia Infographic Series
The Paulownia is one of the fastest growing trees in the world, and has been increasingly used for reforestation efforts due to its high carbon sequestration and regenerative capabilities. It’s also listed as an “invasive species of concern” and viewed as a “noxious weed” by many.
This infographic series, commissioned by an agroforestry consulting company, highlights the many benefits and complexities of this unique tree.
Tools: Photoshop, Illustrator
Tag: infographics, environment


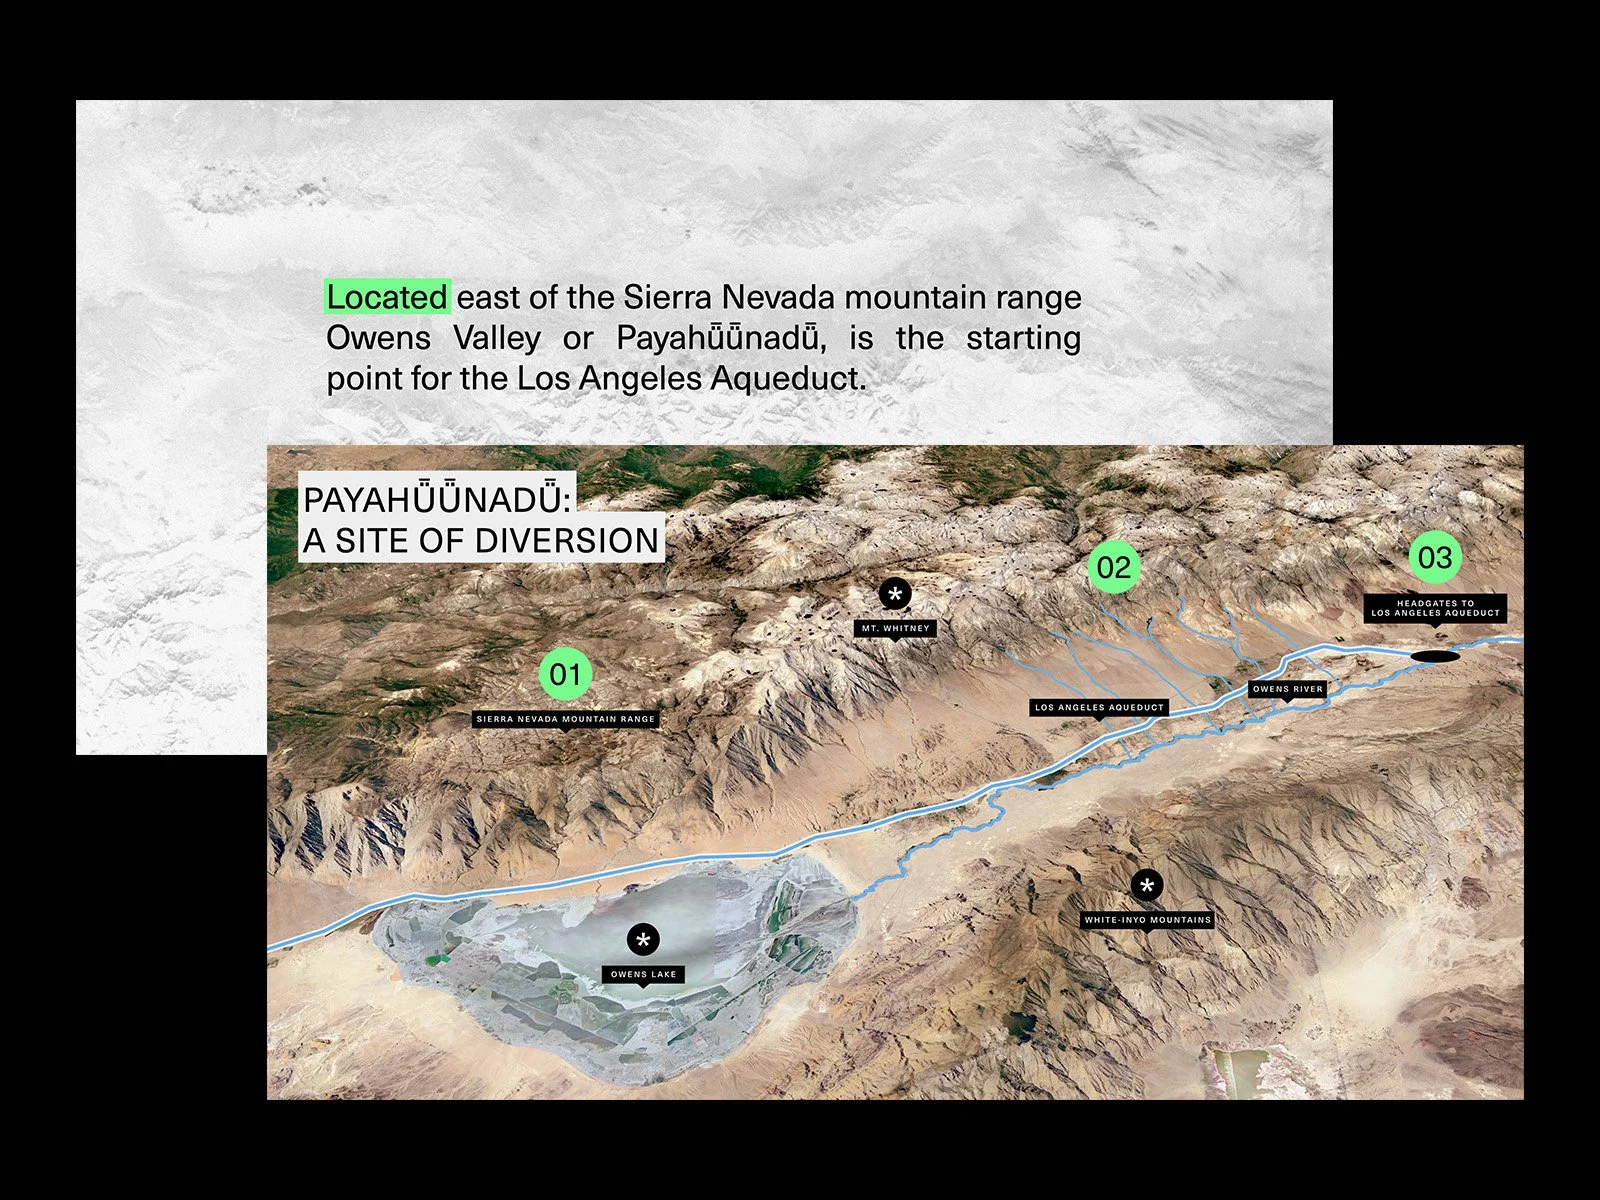
Forgotten Waters: Remembering and Reimagining Water in Los Angeles
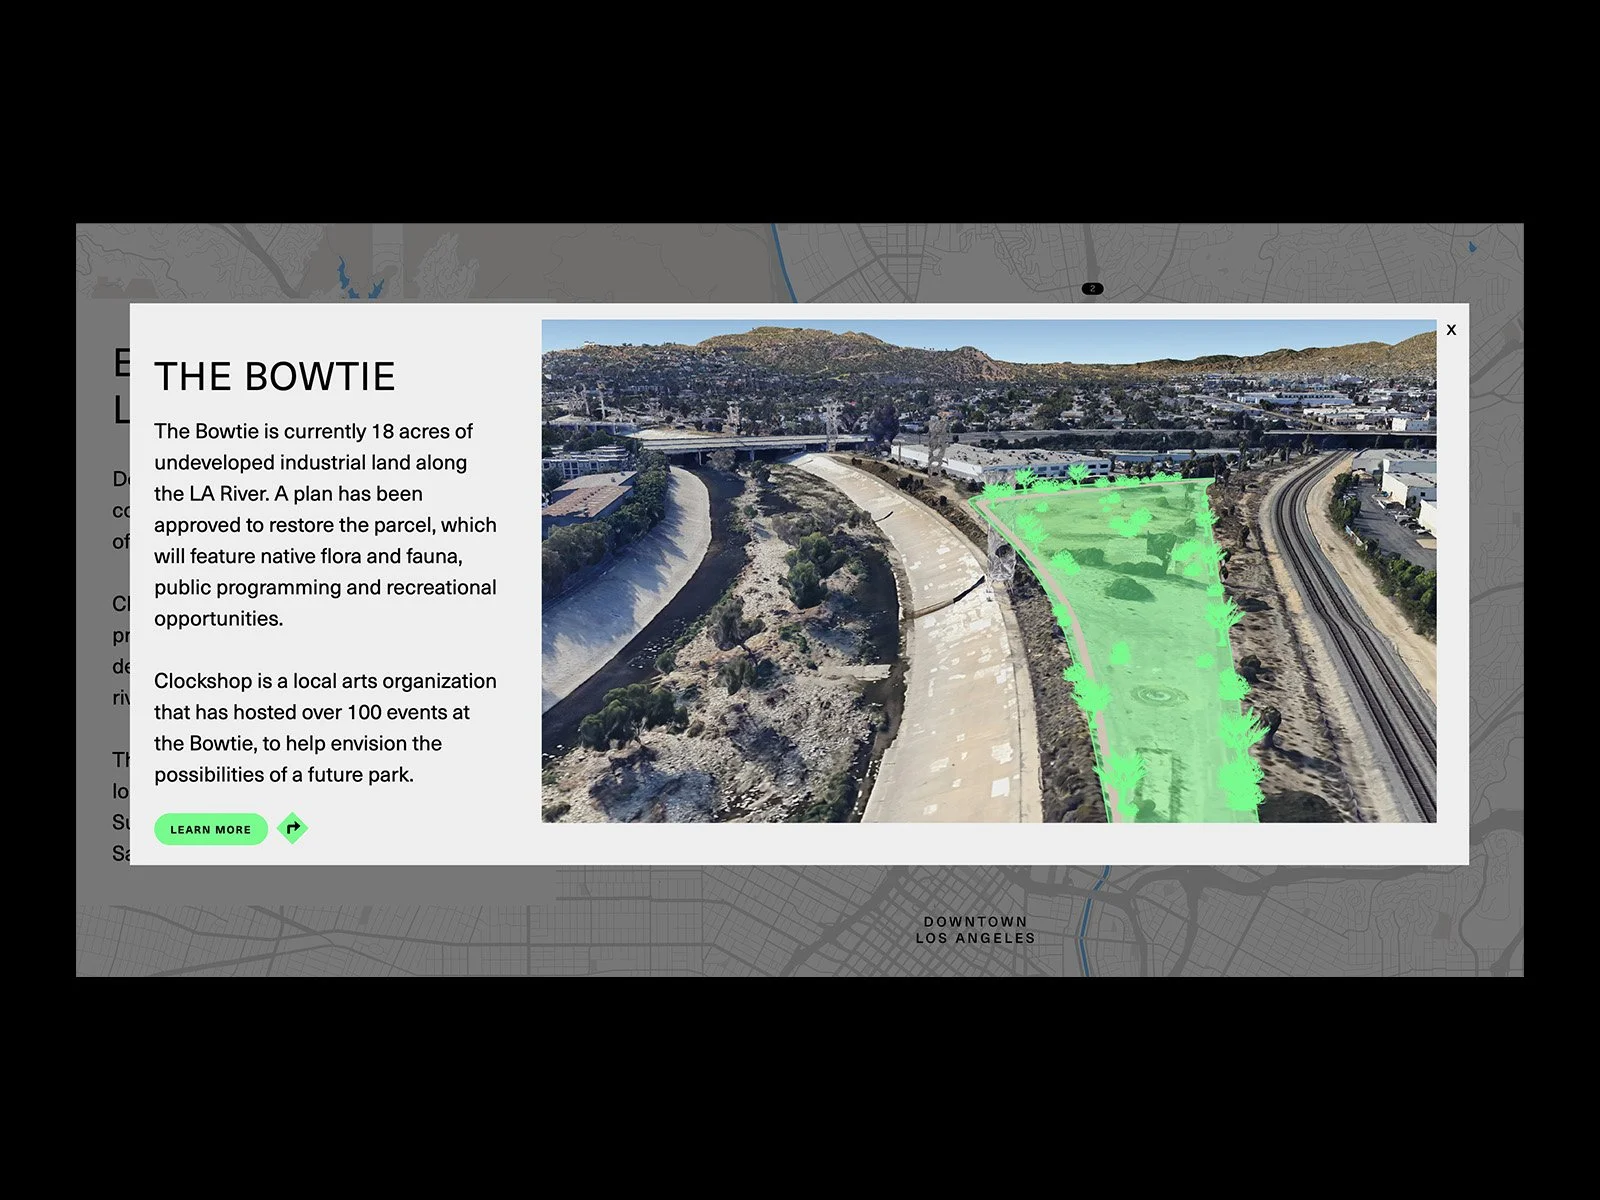
This data-driven microsite explores the history of stolen and diverted water in Los Angeles, from the construction of the Los Angeles Aqueduct to the channelization of the LA River.
It also highlights the many efforts made by organizations along the river, to combine art, technology, science, and community organizing to reimagine the future of water in Los Angeles.
For desktop view only.
Tools: Javascript, Vue, D3, Python, Photoshop, Illustrator, Figma
Tag: thesis, microsite, data visualization, interactive


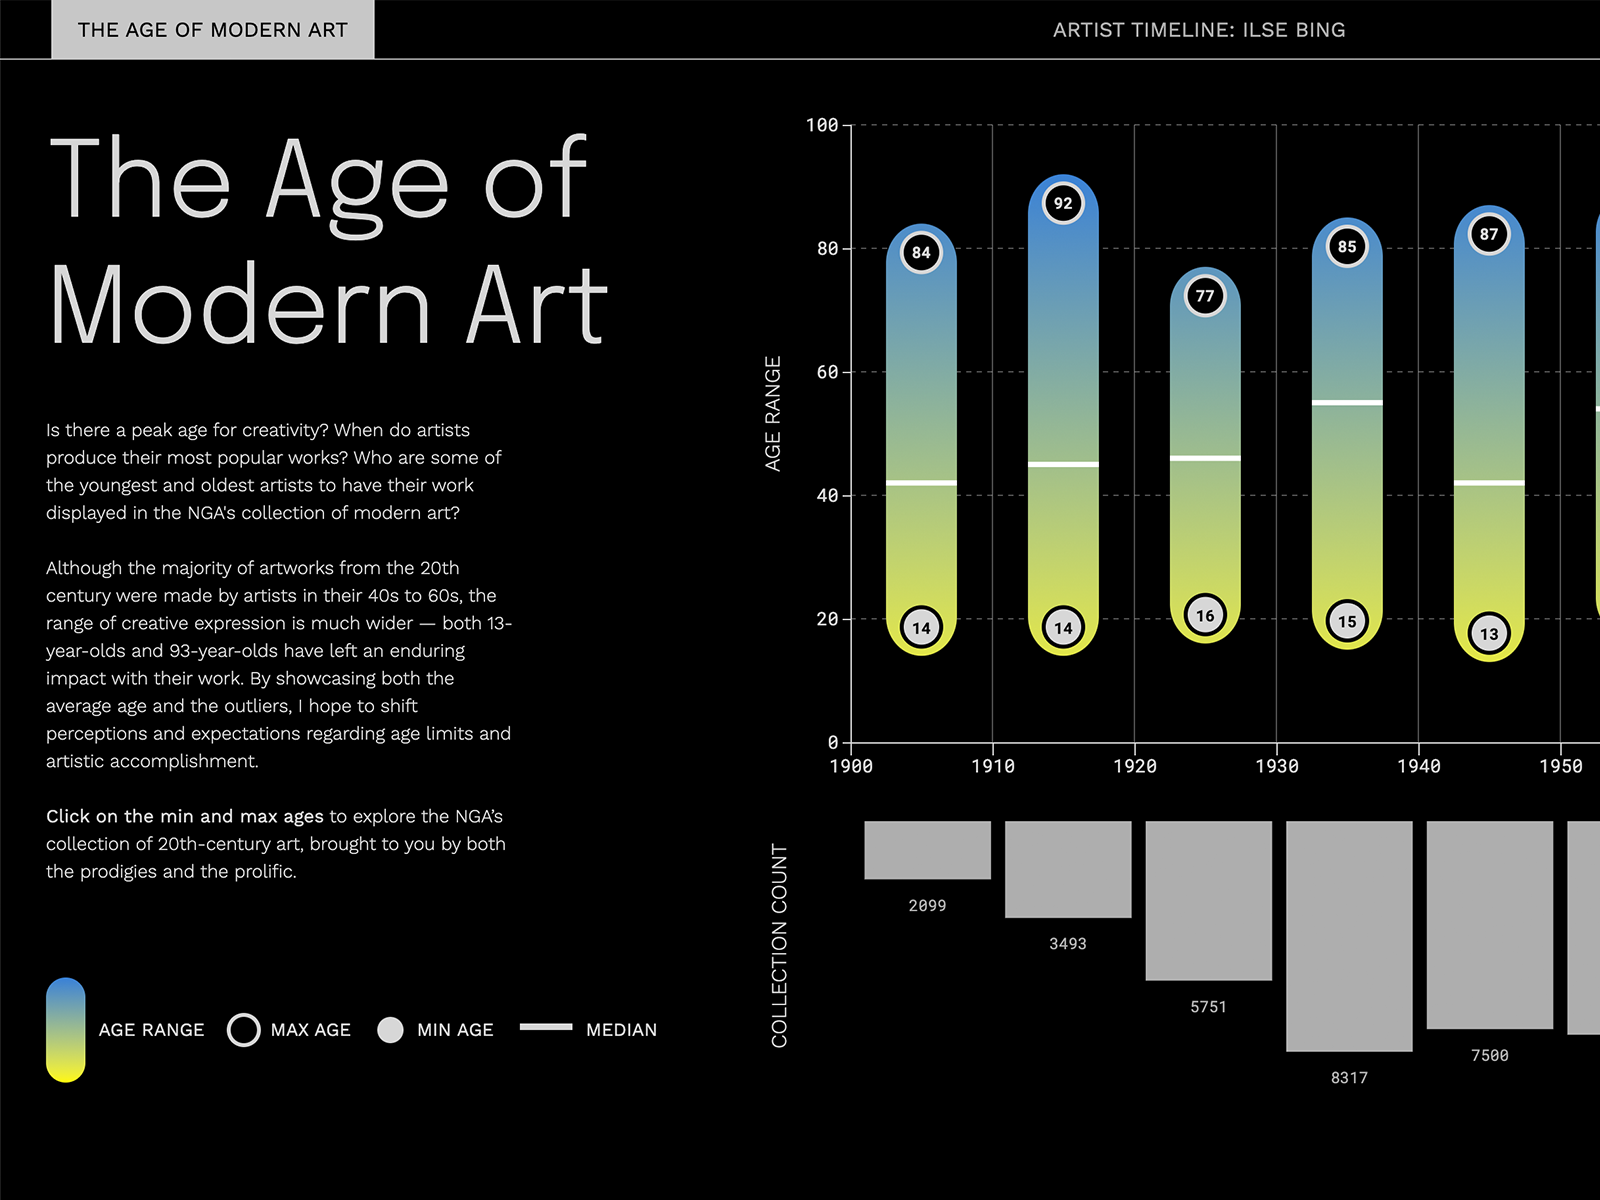
The Prodigies and the Prolific: Exploring Age in The National Gallery of Art
Is there a peak age for creativity? When do artists produce their most popular works? Who are some of the youngest and oldest artists to have their work displayed?
In collaboration with the National Gallery of Art, their open dataset was used to create a three-part interactive visualization exploring the themes of age, mortality, and stylistic changes over time.
For desktop view only.
Tools: D3, Python, Excel, Photoshop, Illustrator, Figma
Tag: data visualization, interactive


Dream Sequence
How do you catalog the fleeting and intangible? Do memories, visions, dreams count as data? This personal dream log turned data visualization is my attempt to bring some abstraction to the quantified self phenomenon.
Tools: Excel, Javascript, D3, Illustrator
Tag: poster, data visualization


Sketches
Select illustration projects, data sketches, posters, and commissions.
Tools: Photoshop, Illustrator, p5, D3, Maya


GoPuff Event
Art direction, design and layout for a branded pop-up event.
Tools: Illustrator
Tags: experiential design, environmental graphics


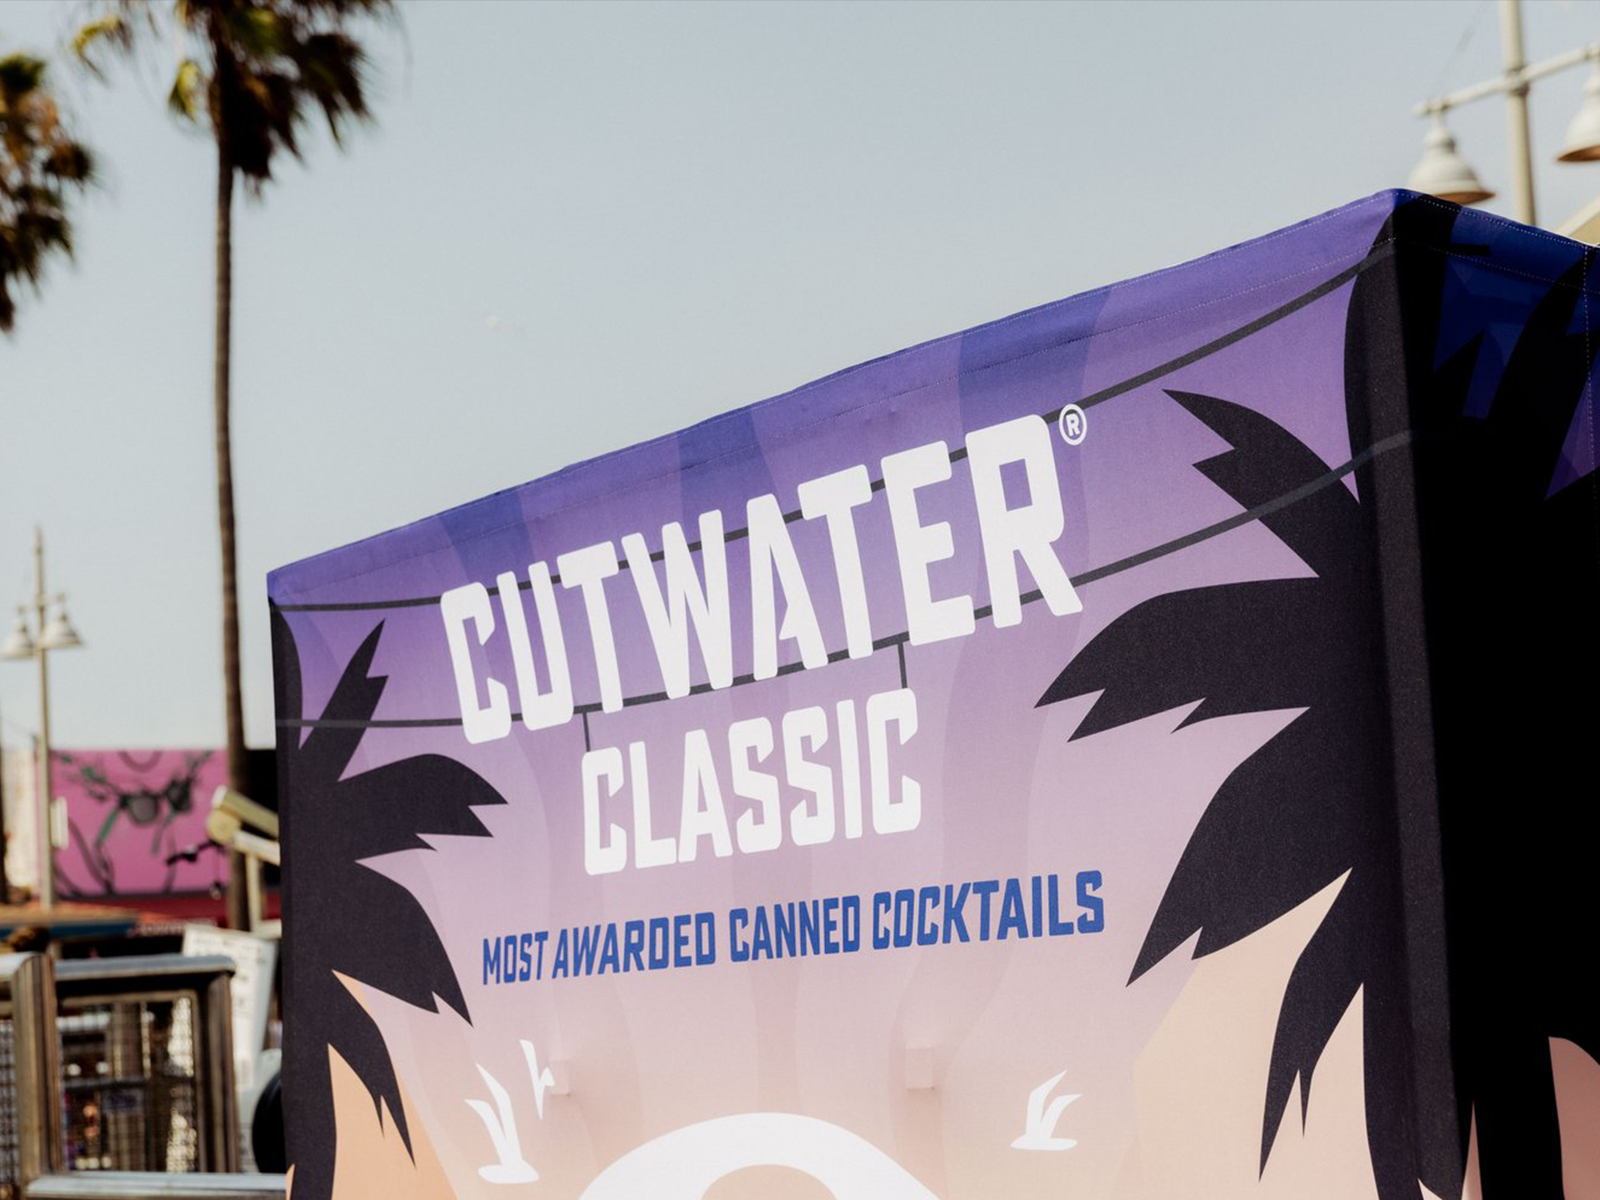
Cutwater Spirits Event
Building on the fastest growing sport in America, The Cutwater Classic Pickleball Tourney was a celebration of sport and love for the game. Over thirty amateur teams competed while 500+ spectators and guests enjoyed Cutwater Spirits, Food Truck Concessions and live music. Held on the iconic Venice Beach Boardwalk guests and players were treated to ocean front views while the high impact pedestrian location allowed for premiere Cutwater branding and visibility to over 15K people per day.
I handled the creative direction, design, and print management for all signage, promotional graphics, and merchandise including banners, directional signage, menus, paddle design, totes, hats, and more.
Tools: Illustrator
Tags: experiential design, environmental graphics, creative direction, print production